Automated Data Feeds
Keep visualizations live with scheduled imports.
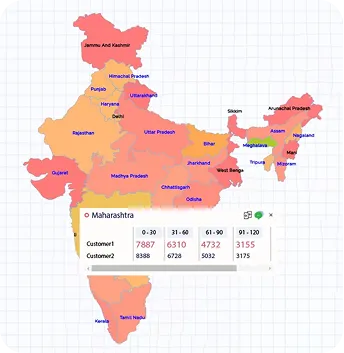
Move from national → state → district → pincode level with interactive drill-down.
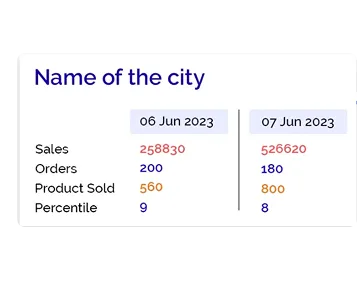
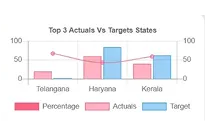
Combine financial, and transaction data into one geo-enabled view.
Evaluate business metrics by state, district, or local market for better decision-making.
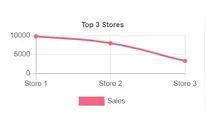
Overlay demographic, sales, and operational data for deeper contextual insights.
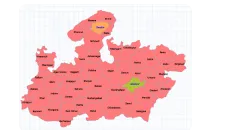
Uncover hidden patterns like top-performing zones, underutilized regions, or market gaps.
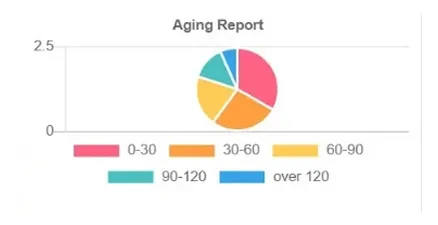
Smart filters highlight only meaningful patterns and anomalies.
Handle millions of records, segmented down to pincode.
View geographic, financial, and operational data side by side.
Push enriched insights back into enterprise systems.
Our engine ensures visualization runs smoothly, keeping teams informed without complex tools.
Auto-pull datasets from databases, APIs, and files.
Plot customer, sales, and resource data with instant geocoding.
Drill into national, state, district, or pincode performance zones.
Generate heatmaps, cluster analysis, and geo-segmented dashboards.

Keep visualizations live with scheduled imports.

Get alerts for sales dips, delivery delays, or regional risks.
Share drill-down summaries with leadership teams.
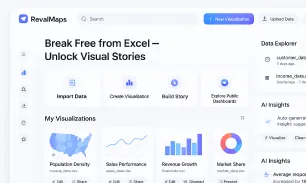
Create executive, operational, and regional map views.

Ensure every map reflects the latest business data.
Revalsys never jeopardises your privacy, and we won't own or sell or abuse data. Remain in constant control of your data by working in a platform that is both data security and privacy certified.
Identify high-potential zones before investing.
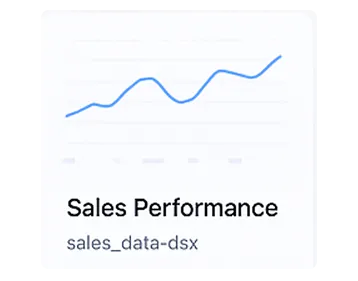

Process real-time data for thousands of locations.
Support for multi-currency, multi-language, and cross-border datasets.

Stay compliant with tax and regional regulations.

Build interactive dashboards for leadership decisions.
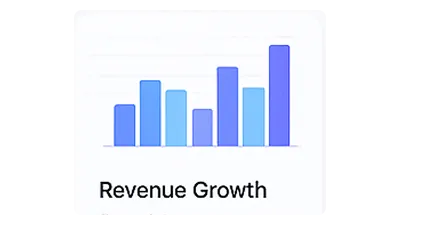
Cut down reporting cycles with instant visibility.
Cut down reporting cycles with instant visibility.
Analyze, optimize, and grow with geo-powered business insights.